Did you know humans process visual information 60,000 times faster than text? Many presentations still use simple charts that don't grab anyone's attention, despite our brain's amazing visual capabilities. The right visualization techniques can turn complex data into compelling visual stories.
But creating effective visualizations means more than picking between pie charts and bar graphs. Modern data storytelling uses interactive elements and smart design principles that make information stick. Presenters now use everything from PowerPoint data visualization to dynamic infographics to bring their data to life.
This piece shows you seven proven visualization techniques to create engaging presentations. These methods will help you boost audience retention and share informed insights clearly. Your presentations will never be the same, whether you're a business analyst, marketing professional, or team leader. These techniques will reshape the scene of how you present data to any audience.
Why Advanced Visualization Matters
Business leaders face a new challenge - they're drowning in data. Professionals spend two hours each day looking for relevant information, which takes up 25% of their work week. Companies don't use 60-73% of their data for any analysis. Advanced visualization techniques provide a solution to this growing issue.
Breaking Through Data Fatigue
Organizations often collect more data than they can handle. Teams become stuck with too many metrics, reports, and dashboards. Extra data slows down decisions and creates confusion instead of helping teams make better choices.
Companies typically show these three problems:
Too many metrics lead to poor decisions
Teams spend too much time gathering data
Different data sources tell conflicting stories
Research shows that only 15-20% of analyzed data links to business results that matter. Advanced visualization techniques filter out the noise and highlight these vital insights.
Creating Memorable Insights
Our brains are wired for visual information - 65% of people learn better through visuals. Presentations with visuals are 43% more convincing than those with just text.
Advanced visualization turns complex data into clear visual stories that:
Make patterns easy to spot in large datasets
Help technical and non-technical teams communicate better
Speed up decision-making by 30% in organizations
People process visual information faster than text. This makes insights easier to remember and use across different departments.
Differentiating Your Presentations
Basic charts aren't enough for today's presentations. Interactive dashboards, custom infographics, and animated visualizations create lasting impressions. Professional visualizations build trust - audiences believe information more when it comes with polished visual elements.
Teams that use sophisticated visualization methods see a 25% boost in productivity. They can find useful insights quickly without getting lost in spreadsheets or text-heavy reports.
Interactive Data Visualization
Static data transforms into dynamic, explorable experiences through interactive data visualization. The audience can participate in finding insights through interactive visualizations, unlike conventional charts. This creates a memorable connection with information. Research shows interactive elements boost audience participation by making data exploration hands-on.
Clickable Elements and Drill-Downs
Presenters can showcase top-level insights while keeping detailed information available through drill-down functionality. The approach works through hierarchical data structures where each data point click reveals deeper information levels. A country's bar chart click might show regional breakdowns and city-level details. Both explicit hierarchies (formally defined data relationships) and implicit hierarchies (informally related data) work well with modern visualization tools.
Drill-downs let audiences:
Follow their curiosity through multiple data levels
Focus on areas relevant to their needs
Find relationships between different data dimensions
User-Controlled Filters and Parameters
Audiences can customize their view through filters that turn passive presentations into interactive experiences. These filters work on entire presentations or specific visualization elements, giving viewers control over data segment display. Different data types need different filter controls - dropdown menus, sliders, checkboxes, or date selectors.
Parameter controls add sophisticated interactions by letting users change calculations or displayed dimensions. Different audience members' varying interests within datasets make this feature valuable.
Implementation in Modern Presentation Tools
Interactive visualizations have become available in presentations. PowerPoint supports clickable elements and simple interactive features. Specialized visualization tools provide more resilient capabilities. Visme's platform includes over 30 data widgets and 20+ chart types designed specifically for interactive presentations.
Best results come from:
Clickable regions with hidden details
User-controlled parameters for testing different scenarios
Cross-filtering between related visualizations on slides
These methods change one-way presentations into shared data exploration sessions. The audience stays involved throughout.
Motion and Animation in Data
Animation gives life to static data. It makes complex information easier to understand and feel. Motion and advanced visualization techniques help us discover insights that static presentations miss.
Revealing Trends Through Movement
Our brains naturally track moving data points, which makes patterns jump out immediately. Animated transitions between different states help us keep context and show how data changes over time. This works especially well with temporal data like fertility rates, economic indicators, or population changes. Static charts often struggle to show these effectively.
Sequential Data Storytelling
Complex visualizations become easier to digest when broken down into animated sequences. This approach prevents information overload. The audience can absorb key milestones at their own pace instead of getting overwhelmed. Racing bar charts show this perfectly. They demonstrate position changes over time and work great for competitive comparisons.
Line charts that animate trace how data points progress. They show trends naturally and draw attention to important areas. This step-by-step reveal creates a story that keeps your audience's attention throughout the presentation.
Animation Best Practices
Here's how to improve impact and avoid common mistakes:
Plan purposefully: Think about what you want to emphasize and how animation will improve your message
Maintain context: Use smooth transitions between states to keep your audience oriented
Apply consistent timing: Related animations should have similar durations to create unity
Choose appropriate styles: Use sequential animations for complex ideas. Simultaneous animations work better for simple changes
The key lies in finding the right balance. Animations should make data relationships clearer without becoming distracting. Well-designed animated visualizations tap into our brain's natural ability to track motion. This helps us process and remember information better.
Infographics: Visual Data Narratives
Infographics blend data and design to create powerful visual stories that simplify complex information. People process visual information 60,000 times faster than text. This makes infographics a vital tool for presenters who want to make data both available and memorable.
Combining Charts with Context
Great infographics do more than just show standalone charts. They add context that improves understanding. Numbers become more meaningful when they connect to a bigger picture, which helps viewers learn about the complete story. This approach turns raw data into useful insights by:
Linking data points to ground implications
Adding background information that shows importance
Building visual hierarchies that naturally guide attention
Charts work better when paired with custom visuals to show relationships. A good example shows how toy shapes display store profit patterns. This creates an emotional bond and helps people understand the data better.
Custom Illustration Techniques
Custom illustrations turn infographics from simple data displays into engaging visual experiences. Technical illustrators know how to turn complex information into clear images. They break down complicated ideas into smaller, easier parts. This makes information stick better—content with visuals gets many more views than plain text.
These illustration techniques work well:
Keeping the same visual style in all graphics
Drawing simple, clean illustrations that highlight important data
Using metaphors to explain abstract ideas
Creating Cohesive Visual Stories
The best infographics tell stories that guide viewers through information step by step. They turn facts into stories with clear beginnings, middles, and endings. Stories work because they connect with our basic need to understand and feel secure.
Good visual stories need careful planning. Start with background information, move through data naturally, and end with key takeaways. Strong infographics stay simple even when showing complex ideas. Each part, from charts to images, must help tell the story without extra details.
Color choices play a vital role in creating unity. Smart color coding directs attention, organizes information, and strengthens brand identity—as long as contrast stays clear enough to read.
3D and Spatial Visualization
The third dimension in data visualization creates both opportunities and challenges that help presenters lift their content. Three-dimensional visualization looks striking, but needs careful thought to avoid common pitfalls that distort information instead of making it clear.
When to Use 3D Elements
Three-dimensional visualization works best with data that's naturally three-dimensional. The best uses include:
Showcasing actual 3D objects or data mapped onto them
Visualizing volumetric data from MRI scans or fluid simulations
Displaying complex spatial relationships that 2D can't show well
Helping audiences grasp data shapes when points overlap often
You should think about whether your visualization really needs the extra dimension. Data without a natural third dimension forced into 3D space creates more problems than solutions. The 3D elements work best when users can interact with them or view them from different angles.
Avoiding Common 3D Pitfalls
The main challenges of 3D visualization come from showing three-dimensional space on flat displays. Two big problems affect most 3D visualizations:
Occlusion happens when front elements block what's behind them. This creates false importance where visible graphics seem more significant. The problem limits what data users can see and might hide vital information.
Distortion occurs because objects far away look smaller than they really are. This perspective effect makes it hard to compare data points accurately.
The data structures in many 3D visualizations can slow down performance as data grows larger. Bad camera and viewpoint choices make things worse by hiding key features behind unnecessary visual elements.
Tools for Creating Effective 3D Visualizations
Some tools excel at making meaningful 3D visualizations:
Tableau has basic 3D features that work well for business intelligence
ParaView offers advanced options for scientific data, with volume rendering and isosurfacing
Unity lets you create interactive simulations and immersive experiences
D3.js with Three.js integration powers web-based 3D visualization
MATLAB has reliable functions for scientific and engineering work
The success of 3D visualization depends on complete preprocessing pipelines matched to your data type. Point clouds need cleanup and normal estimation, while meshes work better with decimation and smoothing.
3D visualization can turn complex spatial data into compelling, informative presentations that improve understanding rather than just looking pretty. This happens only with the right tools and techniques.
Data Storytelling Frameworks
Data storytelling needs more than eye-catching visuals - it needs frameworks that guide audiences through insights. Our brains naturally look for story patterns to process information, so data without proper narrative structure loses its effect.
The Narrative Arc Approach
The Data Storytelling Arc™ offers a four-part framework that turns raw statistics into compelling narratives. This structure has: Setting and Hook, Rising Points, Aha Moment, and Solution and Next Steps. The framework first sets context and grabs audience attention. It then builds tension through data points before revealing a significant insight that changes understanding.
Your data story reaches its peak at the Aha Moment. This combines unexpected insights with clear reasons why audiences should care. Viewers become motivated to tackle problems or chase opportunities shown in your visualization. Traditional narratives follow familiar patterns, and adapting these to data presentations creates frameworks that audiences naturally understand.
Contrast and Comparison Techniques
Comparison stands as a key tool in data storytelling. It gives context that helps audiences make sense of information. Presenters can use contrasts to:
Relate values (high/low, better/worse than previous periods)
Spot patterns and trends across time periods or categories
Back arguments by showing cause-effect relationships
Strategic comparisons turn abstract numbers into meaningful insights. Note that comparison charts make information simpler, and they highlight similarities and differences that aid better evaluation.
Emotional Connection Through Data
Data science now goes beyond analytics. It creates meaningful relationships that drive results. Organizations build emotional connections with audiences by exploiting personalization and targeted insights. Amazon shows this approach well - it uses purchase history and browsing behavior to create customized recommendations that feel relevant.
Data Visceralisation (DVx) works with strategic analysis to boost traditional visualization by connecting numbers to human experiences. This approach creates embodied, sensory experiences that make data more available and emotionally engaging. People process buying decisions through simple emotions like happiness, anger, or surprise before acting. Presentations that match these emotional triggers create smooth experiences for audiences.
Advanced Color Theory for Data
Color plays a vital role in data visualization, yet many people misunderstand its impact. A well-chosen color palette improves both visual appeal and helps audiences interpret data better. Studies show people find information 70% faster when it appears in color, which makes smart color choices crucial for effective presentations.
Strategic Color Coding
Your data type should guide your color palette choice. These three main palette types serve specific visualization needs:
Qualitative palettes use distinct hues for categorical data that doesn't have natural ordering. They work best with discrete dimensional items such as product categories or regions. Your palette should not exceed ten colors to avoid overwhelming viewers.
Sequential palettes match quantitative data that moves from low to high values. Light colors typically represent lower values and darker ones show higher values, which creates a natural visual hierarchy.
Diverging palettes blend two sequential palettes around a central point. This works best for data with meaningful middle values like zero. The approach helps viewers spot extremes and variations from the center.
Using Color to Guide Attention
Colors must serve a purpose rather than just decorate your visualization. You should use color deliberately to:
Set data groups apart
Show numerical values
Draw attention to important data points
Lower saturation in less crucial areas naturally guides viewers toward key insights. Our brains respond quickly to highly-saturated colors because in nature, they often signal threats or opportunities.
Accessibility Considerations
About 10% of males and 1% of females have some type of colorblindness. Most cannot tell red from green. Your visualizations should follow these guidelines:
Skip red-green combinations even though they're common for good/bad values
Keep text contrast ratio at 4.5:1 against backgrounds
Maintain 3:1 minimum contrast between adjacent chart elements
Add patterns, shapes, or text labels alongside color to convey meaning
Tools like COBLIS help test your visualizations for colorblind viewers. Dark backgrounds allow you to use more color shades while keeping sufficient contrast.
How Pitchworx Elevates Data Visualization
Pitchworx leads the vanguard of modern data visualization services by turning complex information into visually striking presentations that engage audiences. This presentation design company excels at converting intricate data sets into clear, influential visual stories.
Expert Design Services
Pitchworx sets itself apart through its integrated approach to advanced data visualization techniques. The skilled PPT designers create presentations that balance visual appeal with information clarity. Their designs make content the focal point while visuals boost understanding. The design process follows several core principles:
Clean, purposeful design that amplifies your message without overwhelming it
Strategic visual storytelling that maintains audience interest
Eye-catching visuals that improve comprehension and create lasting impressions
The company's expertise goes beyond simple PowerPoint capabilities into specialized visualization domains like interactive dashboards, custom infographics, and animated data sequences. This complete skill set helps them tackle complex visualization challenges in a variety of industries.
Case Studies of Transformed Presentations
Pitchworx's partnerships with various organizations have produced remarkable results. The company's work with marketing teams brings campaigns to life through bold, informed marketing decks. Their corporate presentation designs deliver complex messages with maximum impact and professionalism.
The company's pitch deck design services help investors by turning complex information into compelling visuals that maximize impact. Their approach makes information not just visible but instantly understandable.
The Collaborative Process
Pitchworx serves as a creative partner for organizations from startups to government agencies. The team starts by understanding client's brand guidelines and design language, then integrates these elements into visually engaging slides.
The company makes use of state-of-the-art technology and human creativity. They blend AI technology with creative design approaches to craft immersive experiences that raise brand presentations. This balanced method ensures their data visualization work stays technically sound and emotionally compelling.
Implementation Tools and Resources
Creating effective data visualizations needs the right mix of tools and expertise. Your choice of software based on specific needs builds the foundation to tell compelling visual stories from complex data.
Advanced PowerPoint Techniques
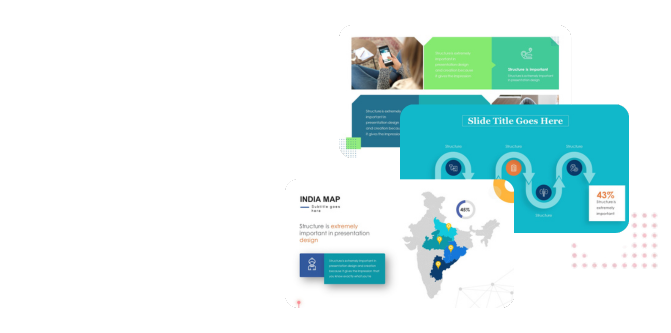
PowerPoint serves as a flexible platform for data visualization with features many presenters miss. The Chart Design menu gives you many more options beyond simple graphs. Your data type helps you pick the right visualization format - speedometer dashboards for KPIs, thermometers for growth metrics, or creative pie charts for categorical data.
Here's how to make better PowerPoint visualizations:
Make use of dual-axis charts to compare related metrics at once
Add custom data labels and callouts that guide viewer focus
Use animation sequences that show data step by step
Templates give you ready-made layouts for consistent presentations that match your brand priorities. PowerPoint also supports SmartArt graphics to create diagrams and flowcharts. You can connect it with Excel for better data handling.
Specialized Visualization Software
PowerPoint works well, but dedicated visualization platforms do even more. Tableau lets you build interactive dashboards where users can click elements, drill down, and control filters. Flourish turns raw data into interactive visuals without coding - perfect for scrollytelling and interactive presentations.
Visme shines with over 30 data widgets and 20 chart types. You can add custom animations and interactive maps. Each platform has its strengths. Tableau works best for business intelligence, Flourish for storytelling, and Visme for complete design options.
Learning Resources for Skill Development
Your path to mastering data visualization depends on career goals. You can take structured courses from basic to advanced levels. Certifications prove your skills with specific tools. Executive education programs focus on advanced strategies for leaders.
The community helps you learn continuously:
Workout Wednesday challenges help practice Tableau skills
Makeover Monday helps refine design approaches
Visualization experts like Andy Kriebel and Kelly Martin share their knowledge through blogs
These resources help you move beyond simple charts to create sophisticated visualizations that make presentations stand out.
Conclusion
Modern presenters use advanced data visualization techniques to turn complex information into memorable stories. Interactive elements, animations, and well-designed infographics help create engaging experiences that appeal to audiences well after the presentation ends.
This piece outlines several approaches that raise data presentations' impact:
Interactive visualizations that encourage audience exploration
Motion and animation techniques that show patterns clearly
Infographic frameworks that blend data with compelling narratives
Strategic color choices that boost understanding and maintain accessibility
Three-dimensional representations for specific data types
Data storytelling structures that build emotional connections
The successful application needs both technical expertise and creative vision. PitchWorx's presentation design experts will give your data visualization projects professional attention backed by years of experience.
Data visualization keeps evolving with technology and gives presenters sophisticated tools to communicate complex insights. Modern presenters can now turn overwhelming datasets into clear, applicable information that shapes decisions and sparks action.
FAQs
Q1. What are some advanced data visualization techniques that can transform presentations? Some advanced techniques include interactive elements with clickable drill-downs, animated data storytelling, custom infographics, 3D visualizations for spatial data, strategic color coding, and narrative frameworks that create emotional connections with the audience.
Q2. How can interactive data visualization enhance audience engagement? Interactive visualizations allow audiences to explore data hands-on, with features like clickable elements, user-controlled filters, and drill-down functionality. This transforms passive presentations into collaborative data exploration sessions, keeping viewers engaged and helping them discover insights relevant to their interests.
Q3. What role does color play in effective data visualization? Color is crucial for guiding attention, representing values, and distinguishing between data groups. Strategic use of color can help locate information 70% faster. It's important to choose appropriate color palettes for different data types (qualitative, sequential, or diverging) and consider accessibility for color-blind viewers.
Q4. How can animation be used effectively in data presentations? Animation can reveal trends over time, break down complex information into digestible sequences, and highlight important data points. Effective use of animation maintains context between transitions, applies consistent timing, and enhances understanding without becoming a distraction.
Q5. What are some best practices for creating impactful infographics? Effective infographics combine charts with contextual elements, use custom illustrations to simplify complex concepts, and follow a cohesive narrative structure. They should maintain a consistent visual style, use simple and clean designs, and strategically apply color to guide the viewer's attention through the information.